

Cash Monitoring Center by CubeIQ
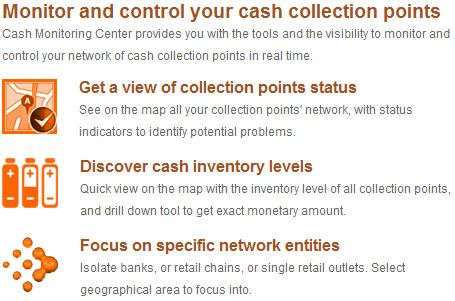
The CMC System Implementation
Strong User Interface on Google Maps® backdrop
The web based CMC application is interacting with the user via a screen split in two vertical sections. The right section is showing the thematic map with the network entities. This is an elastic rectangle area occupying the right part of the internet browser window, resized automatically, as the browser window shrinks or expands in width and/or height.
Upon entering the system, and before signing-in, the only entity presented on the map is the "CMC" by its map marker (icon).
The left section of the window is the area where the textual data are presented, and the user interacts with certain application controls that will be presented below.
User credentials are provided in the sign-in page as shown below:
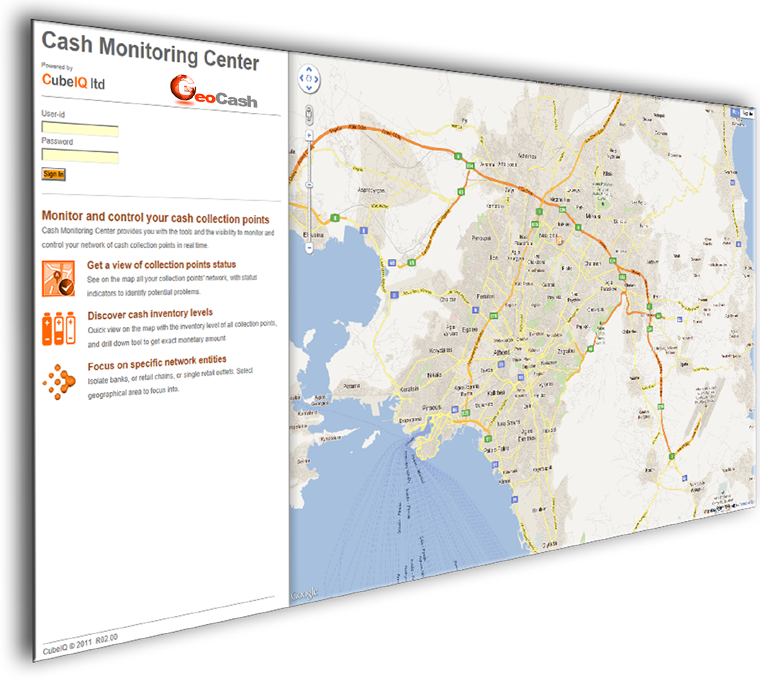
Upon user sign-in, the next page appearing is the so-called "Map View".
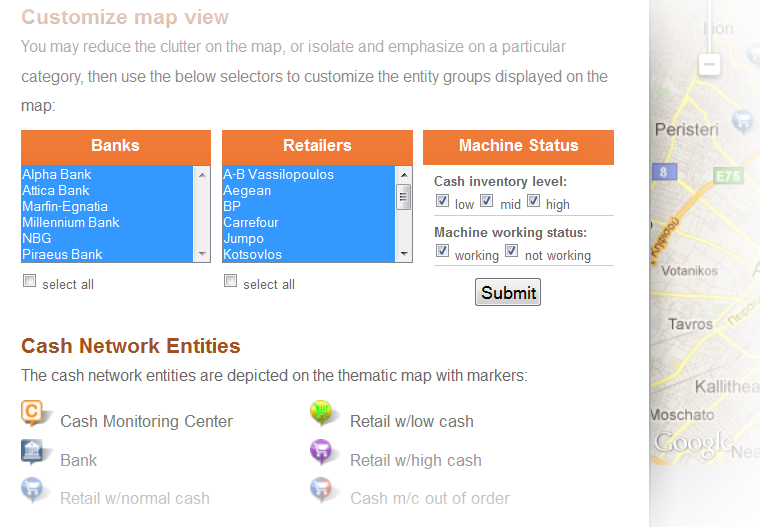
By entering this page (screen state = 2), the thematic map projects all entities by default; i.e. the Banks (by its headquarter premises) and the Retail Outlets represented by "map markers".
By clicking on any network entity map marker a "marker info window" is thrown on the map, depicting few primary details for the respective entity.
Using the selectors’ dashboard, the operator may reduce the clutter and focus on selected banks and/or retail outlets. This is aiming to selectively screen (reduce) the network entities shown on the map, by offering a number of controls to the user, as presented below:
On the top of the left section, there is a "horizontal menu" offered to the user, showing the following selections:
- Map view
- Entities
- Sign out
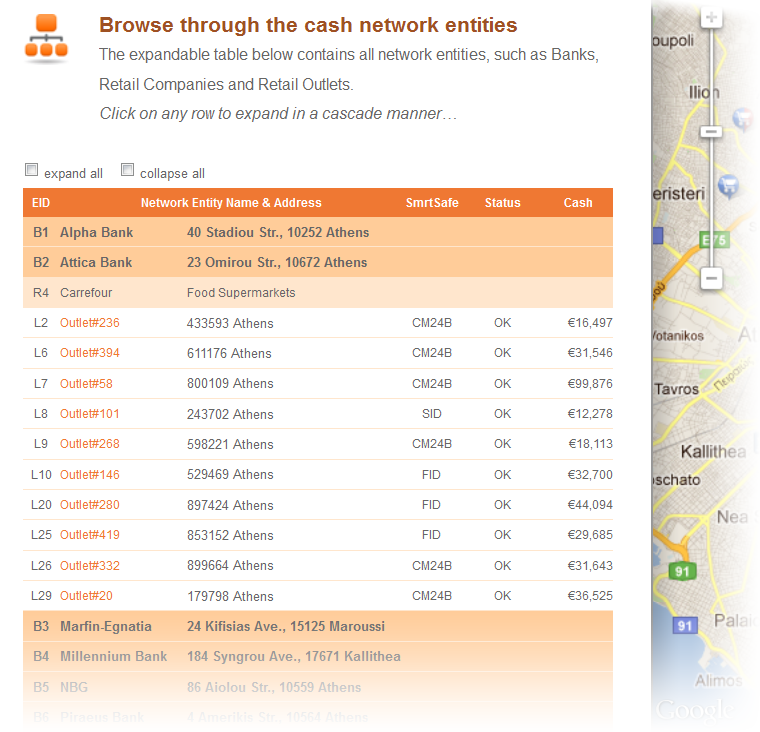
Selecting the option to transfer to the "Entities" screen, we get a collapsible list with all the network entities, from the viewpoint of the "business model" hierarchy. Originally the list is presenting only the top level entities; i.e. the Banks.
By clicking on any "Bank" row, the inner rows of dependent retail companies are expanded downwards.
By clicking on any "Retail Company" row, the inner rows of associated retail outlets are expanded downwards. Primary status details are shown for each outlet, such as:
- CSS model
- Working status
- Cash inventory
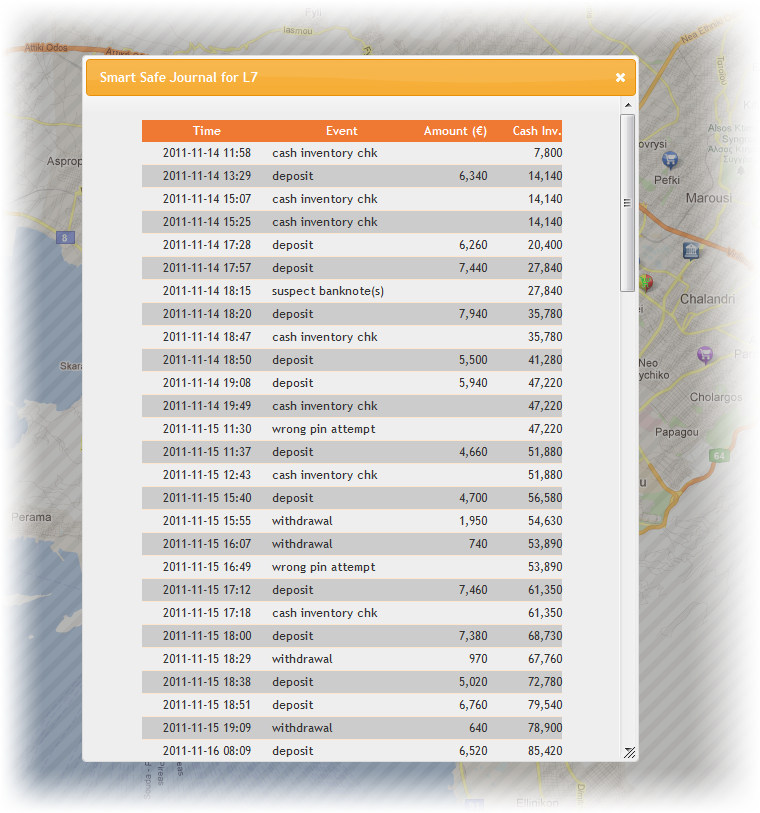
By clicking on the retail outlet name, there is a modal pop-up window appearing on the screen center, where -after interrogating with the respective terminal device- the CSS "journal" for the most recent period is displayed. Hyperlink to this "Journal" pop-up window is also offered on the map marker info window.
This entities list is shown in the following snapshot:
Below is shown a picture of the CSS journal as it appears on the GeoCash CMC screen:
![]() best user experience
best user experience
Try out the GeoCash CMC demo…
Use user-id: demo and password: ciq

 RSS feed